Deep dive · AMUSE Art Museum
Understanding visitors and the market.
My research explored how people discover and plan museum visits, alongside how people in Kenya access the internet and make payments.
Understanding the visitor
Interest was easy to find. Practical information was not.
I wanted to understand how people in Kenya find museums and exhibitions, and what makes it difficult to plan a visit. Given the time I had, I focused on surveys, then used what I learned to create a persona and map the visitor journey.
I found that people often discovered exhibitions on social media but struggled to take the next step. Prices, dates, and visit details were scattered across websites that weren’t always easy to use on a phone, and booking wasn’t straightforward.
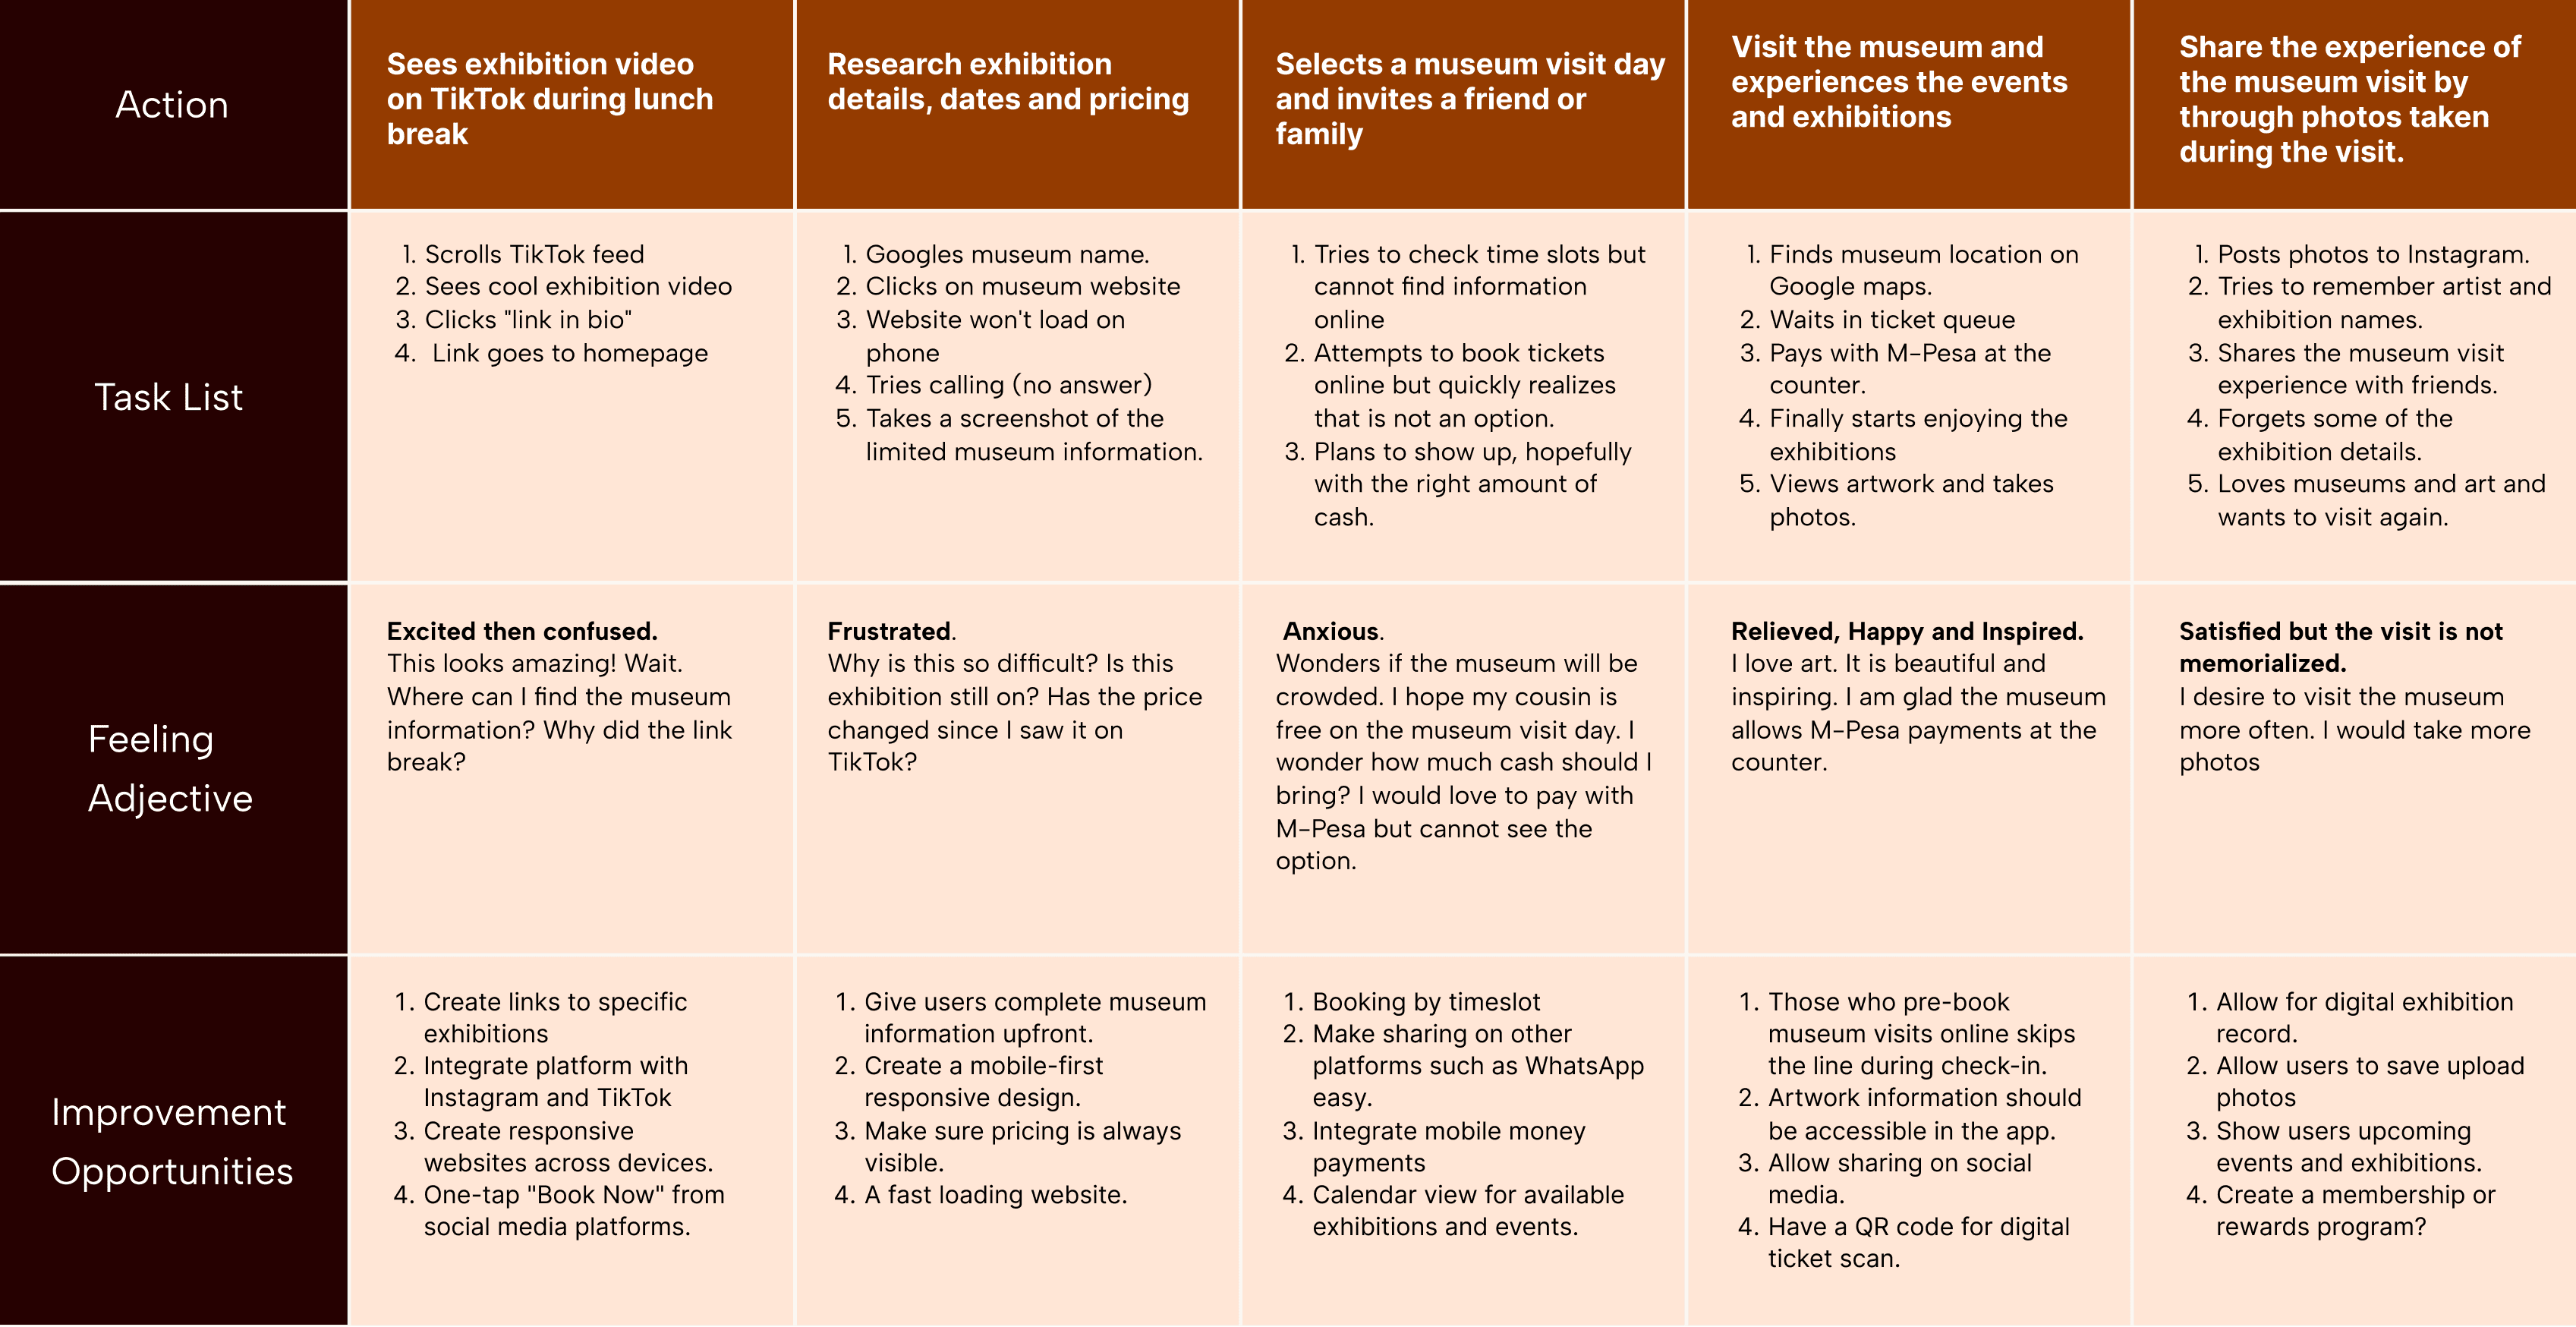
User Pain Points
Incomplete information online
Users cannot find essential details like pricing, time slots, reviews, and accessibility information before booking.
No mobile-money (M‑Pesa) booking
Museums don’t offer M‑Pesa for online bookings, forcing users to buy tickets at the door and limiting convenience.
Mobile-unfriendly websites
Museum sites are desktop-focused and often unresponsive across devices. Broken layouts, slow loading, and hard navigation lead to immediate abandonment.
The discovery-to-booking disconnect
Users find museums via social media (TikTok, Instagram) but face friction during booking because of limited information.
Creating a persona
Putting the findings into context.
These pain points were connected, each making it harder to plan a museum visit. I used the survey findings to create Mary, a persona that helped me see how these challenges could affect one person’s experience and keep her needs in mind throughout the design process.
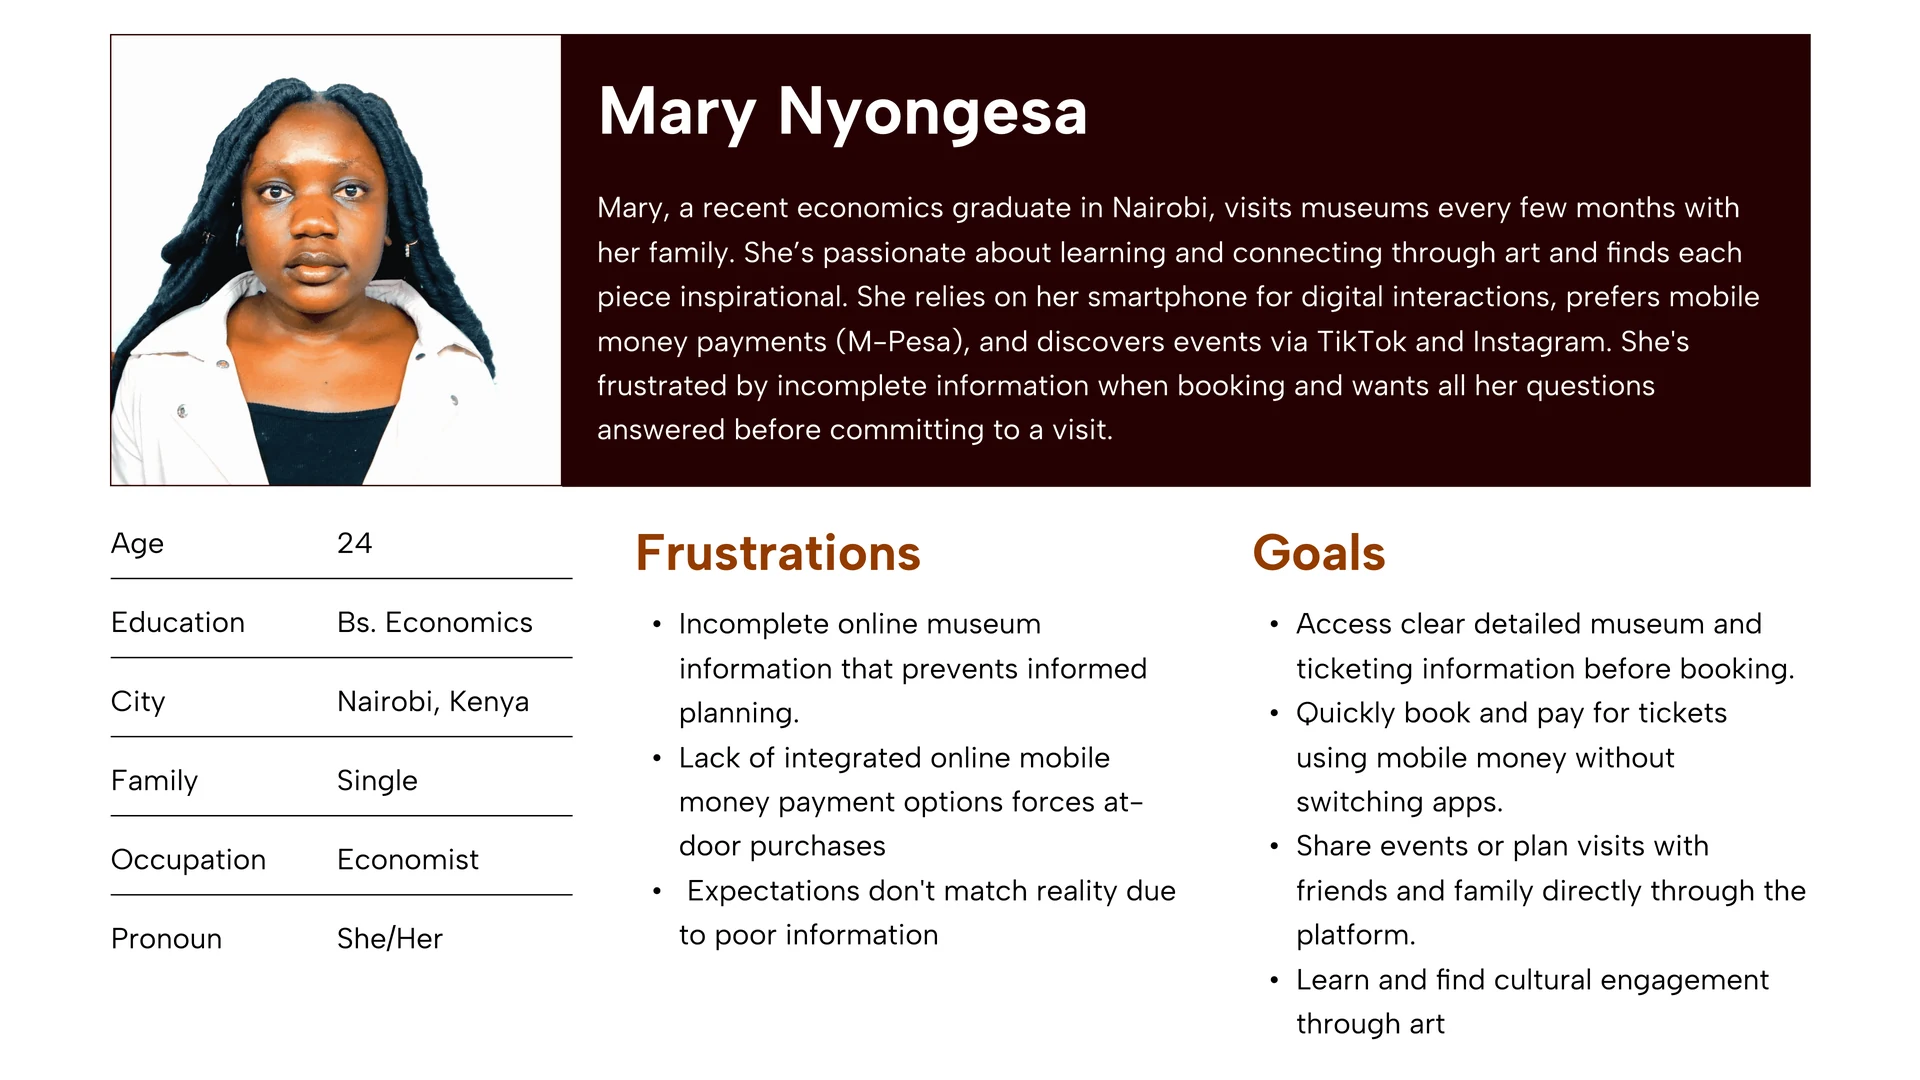
Understanding the market
Mobile-first, but not one kind of phone.
Most people in Kenya reach the internet on a phone, but those phones vary widely. In July to September 2024, the Communications Authority counted 37.4 million smartphones on Kenya’s networks alongside 30.7 million feature phones. Across Sub-Saharan Africa, GSMA reports that most people covered by mobile broadband still don’t use it, and names the cost of smartphones and digital skills as the main barriers.
Payments point the other way: mobile money is everyday infrastructure. Safaricom reported 35.8 million monthly active M-Pesa customers in the year to March 2025.
For AMUSE, that meant designing for the phone first, keeping the experience light enough not to ask much of a device or a data plan, and putting M-Pesa at the centre of checkout. None of this assumes every visitor has an older phone or a slow connection; it means not shutting out the ones who do.
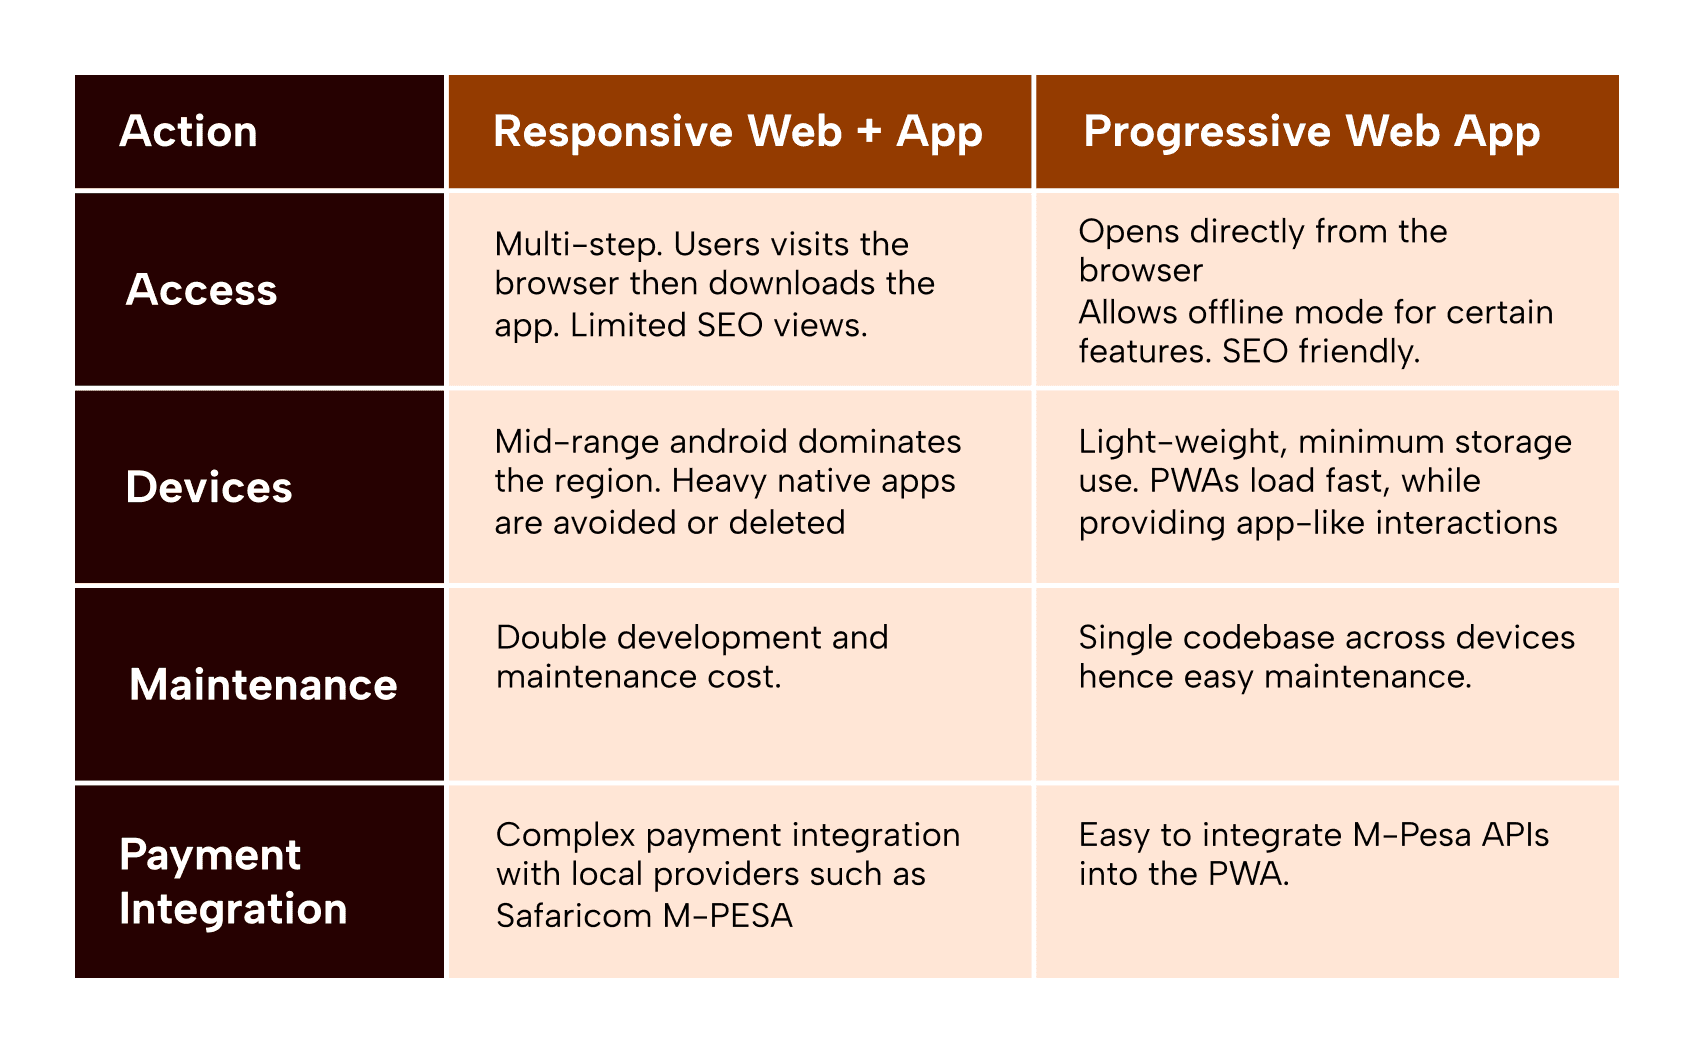
Understanding the alternatives
Few visitors install a museum app.
I reviewed museum apps including Smartify, Google Arts & Culture, DailyArt, and The Met’s. Few single-museum apps were still being maintained; the field had moved toward platforms that host many institutions, such as Bloomberg Connects.
The adoption evidence pointed the same way. A 2017 museum field study found that 98% of the visitors it surveyed had no museum app on their phone. An app also has to survive after it is installed: across Android apps in general, Quettra’s data showed the average app losing 77% of its daily users within three days of install. For a product most people would use for an occasional visit, asking for a download looked like the wrong first step.
98%
of museum visitors surveyed had no museum app on their phone.
Museum field study, 2017
77%
of an average Android app’s daily users gone within three days of install.
Quettra, 2015 · apps in general
What research changed
Three decisions traced back to it.
One connected journey.
The pain points pulled in the same direction, so Discover, Plan, and Book became one flow rather than separate pages.
A responsive, PWA-style web product.
Varied devices, the cost of data, and low app adoption made a browser-first product the lighter path to the experience.
Local payments first.
No mobile-money booking was one of the four pain points; M-Pesa leads the checkout, with card payment kept.
Sources
Where the figures come from.
- Increased smartphone adoption and mobile money drive growth in telecoms sector (opens in a new tab)Communications Authority of Kenya, January 2025. Sector statistics for July to September 2024: smartphones, feature phones, mobile data, and mobile money subscriptions.
- The Mobile Economy: Sub-Saharan Africa 2024 (opens in a new tab)GSMA, 2024. Regional figures for Sub-Saharan Africa: mobile internet use, the usage gap, and its barriers.
- FY25 results press release (opens in a new tab)Safaricom, May 2025. One-month active M-Pesa customers in the year to March 2025.
- Field study: benchmarking visitor behaviors and mobile device usage in the museum (opens in a new tab)A 2017 practitioner field study of museum visitors and their phones; the source of the share with no museum app installed.
- New data shows losing 80% of mobile users is normal (opens in a new tab)Andrew Chen with Quettra, 2015. Retention across Android apps in general, measured in daily active users; not museum apps.
- Museum app: why visitors don’t use it (opens in a new tab)Audio Cult, May 2025. The article my competitive study drew these figures from; it sells web-based guides.
- Museum audio guide apps: only 2.47% of visitors download them (opens in a new tab)Nubart, data to August 2025, after this project: an estimated 2.47% average download rate across 175 European and US museum apps. Later context, not part of the original decision.